Most digital marketers nowadays realise the importance of site speed and how it impacts users perception of your brand. People hate wasting their time waiting for loading bars to fill.
When it comes to speed, first impressions count.
The great thing about site speed being widely regarded as a critical metric to impacting conversion rate is that there are now many excellent site speed tools to diagnose and monitor your site.
The first range of tools sits firmly within the diagnosis category. They give you insights into what is wrong and what you need to do to fix them. There are plenty of these available, and to be honest, a lot of them don't do anything new.
The second group of tools help with monitoring, and I'm seeing more and more of these types of speed tools come out.
A lot of these monitoring tools usually make use of ongoing reports from the fantastic Google-made Lighthouse tool and their open-sourced Chrome User Experience Report data.
Within this article, I will run through both types of tools and provide some recommendations for which ones I recommend!
Site speed diagnosis tools
First, I will run through some of the top diagnosis tools to use. Rather than list every tool out there, these are just the crème de la crème of the diagnostic tools that you should be making use of.
PageSpeed Insights
This one should be obvious! PageSpeed Insights has been around for a long time now, and its recent update and introduction of lighthouse metrics combined with CrUX field data has made it even more valuable.
When diagnosing a site, this is usually my first port-of-call primarily because it reports back user-centric performance metrics.
The basis of the tool is that you want to be aiming for a high score. It has two tabs, one for mobile and one for desktop. The mobile tab is the default, and this is where you should focus. I usually focus on making improvements here as the tab simulates what could be considered the worst-case scenario for site speed.
The majority of the web is now mobile, and in most cases, so will your site's traffic. If you get good scores on mobile, desktop will be especially quick.
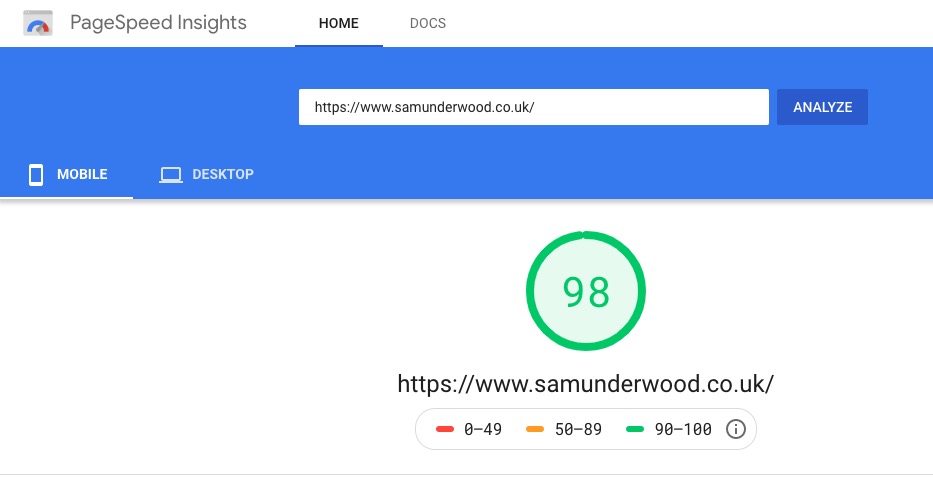
For mobile, the tool simulates a mid-tier device (Moto G4) on a mobile network (roughly 1.6Mbps down / 750 Kbps up with a latency of 150ms).
After the score, the tool gives you 'field data'. This is data that is collected from actual users visiting your site. The speeds are categorised as fast (green), moderate (yellow) and slow (red).

If you go further down the page, you get what is called 'lab data'. This is a snapshot of your performance when the lighthouse tool checked your page when you clicked analyze.

In the next section, the tool gives you a variety of insights into how you can improve your site speed.
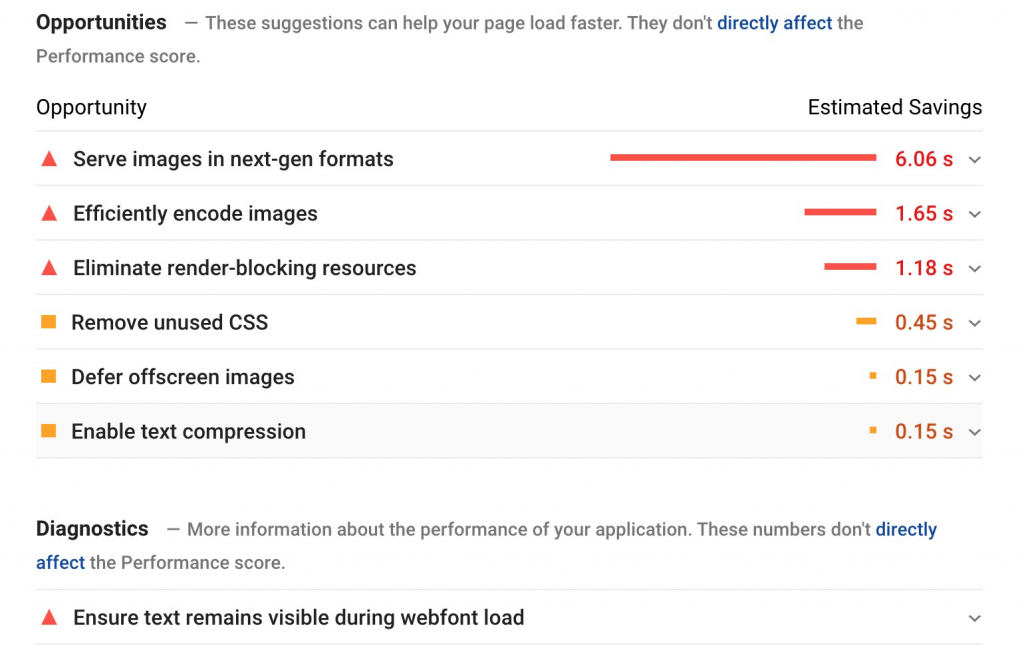
The great thing about a lot of the advice given here is that these aren't things you'll find in any other tools. Often, you will find other tools not making use of Lighthouse will say you've got high scores, and then you'll try out PageSpeed Insights and find lots of issues.
This is all due to PageSpeed Insights focusing on ways in which to improve perceived performance rather than just your final page load time. A lot of these will also impact your total page load time, but it's more important to a user how quickly your content is visible and that they can interact with the page, which is precisely what PageSpeed Insights shows.
Tools that use page load times as a metric to focus on would highlight that some external JS file is loading slow in the background, but it's not impacting the user's experience on the site, so is it essential?
Probably not.
Another thing to consider with this tool is that it is incredibly time-consuming to get a perfect 100 score, especially on mobile. Eventually, you will get to the point of diminishing returns, so try not to obsess over the score, utilise the field data, and instead focus on ensuring your users have a good experience on your site.
web.dev
Next up, we've got the measure tool at web.dev. I won't linger too long on this one, as essentially, it's a reskin of PageSpeed Insights with some other Lighthouse reporting around accessibility, SEO, best practices and without the CrUX field data.

One handy additional feature you will find here is the ability to create an account and track your site performance over time using Lighthouse. All free-of-charge.
GTMetrix
GTMetrix is a great tool that combines speed diagnosis from the older version of PageSpeed Insights alongside YSlow. It also has a page timings report, a nice waterfall chart, and it can also do a video recording of your page loading.
One thing I'd love to see in this tool is for it to remove the focus on the 'fully loaded time' metric. This site is a great example of why.
We have a relatively high fully loaded time considering how well we score in PageSpeed Insights. The reason why is because we preload other URLs into the browser once it has finished downloading the current page. This makes the load times almost instant when the user navigates to the next page. You can see that happening at the bottom of the Waterfall chart in GTMetrix:

If you go into the timings report, you can see my site looks a lot faster:

Pingdom
Pingdom's site speed tool is another excellent tool to take a quick check of your site speed. It includes similar suggestions to GTMetrix, albeit with no examples.
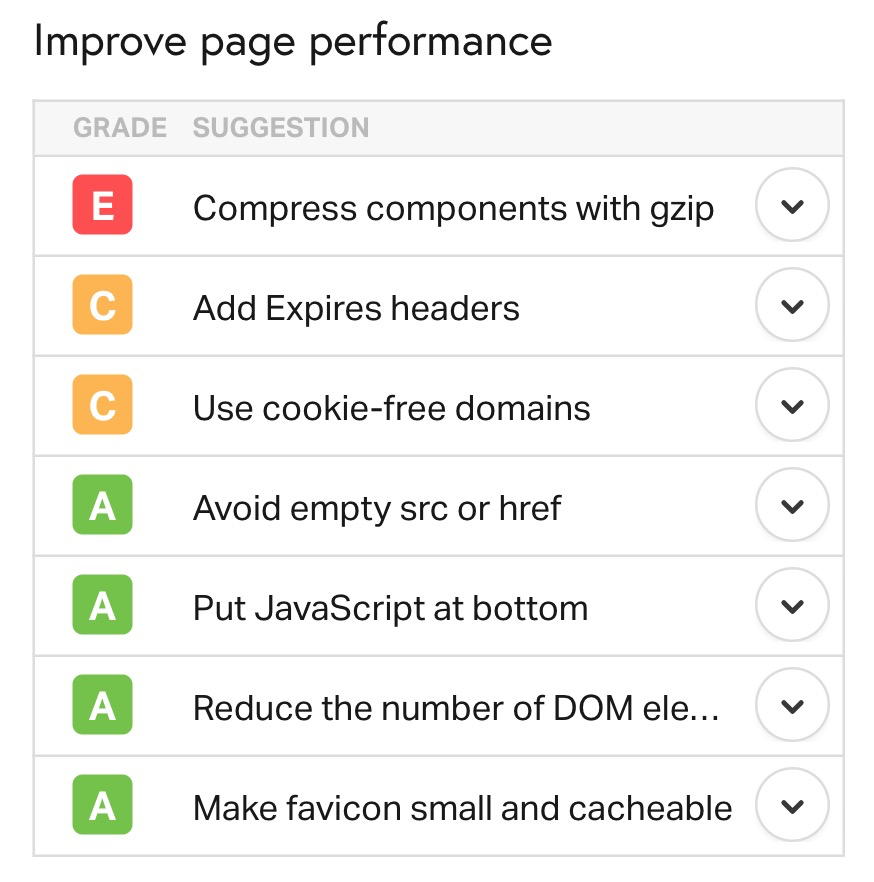
For example, for the above suggestions, Pingdom doesn't give feedback on which files aren't being compressed with GZIP, which is a shame.
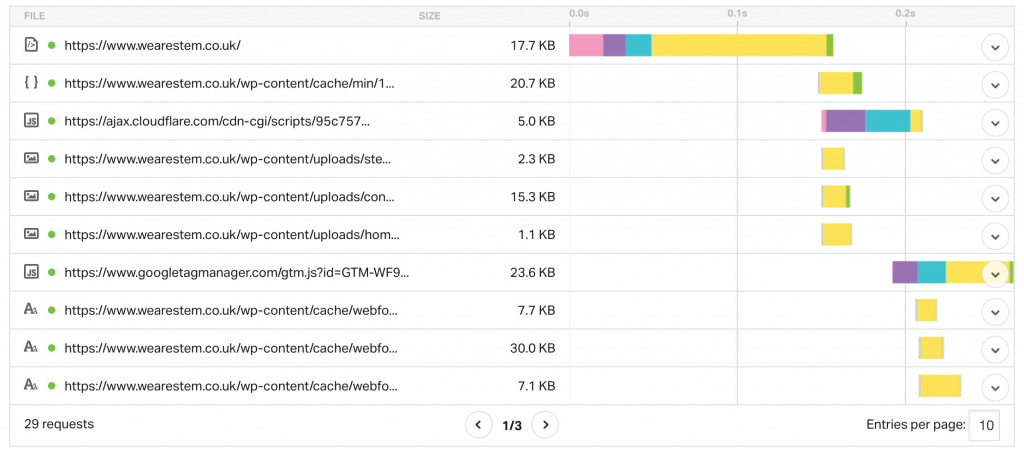
What is handy within Pingdom is the overview it gives on requests and file sizes by type alongside requests and size by domain:
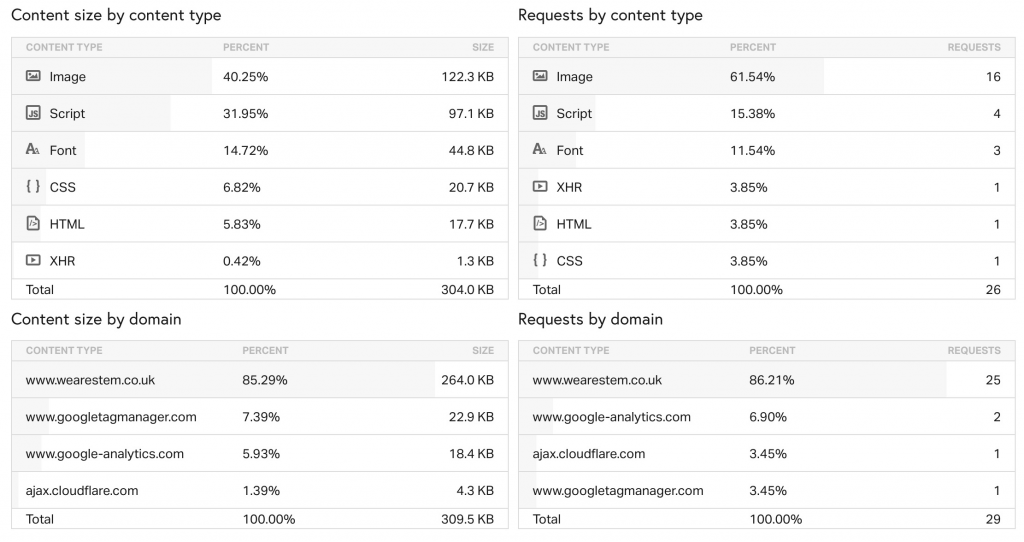
This can be useful to know where you should focus your speed optimisation efforts. For example, if you can see images are making up most of your file size, maybe take a look at compressing them/reducing quality, lazy loading or converting them to an image format like WebP.
Like GTMetrix, there is also a convenient waterfall chart at the bottom.
Speed monitoring tools
Next, I will run through some of my favourite performance monitoring tools. It's essential to manage performance on an ongoing basis to ensure over time, you don't start adding more and more bloat to your site.
You can prevent adding bloat to your site by getting processes in place to monitor and by setting performance budgets. The below tools will help with this!
Calibre
A personal favourite of mine is called Calibre. It's a bit more of a premium tool, but it is also very feature-rich at the same time.
The tool is again based on Lighthouse data, which is excellent. The tool allows you to run Lighthouse reports over time on a schedule and store that information, making it ideal for spotting trends.
I love this tool because it allows you to run Lighthouse reports with custom network conditions, URLs, and devices that you can choose. For example, if you know most of your users use an Apple iPhone and they have more money to spend, you can set up a device as a higher-end iPhone and track what performance would be like on that device.

It doesn't just give you the top-level performance scores either. You can also see all the other scores Lighthouse reports on.
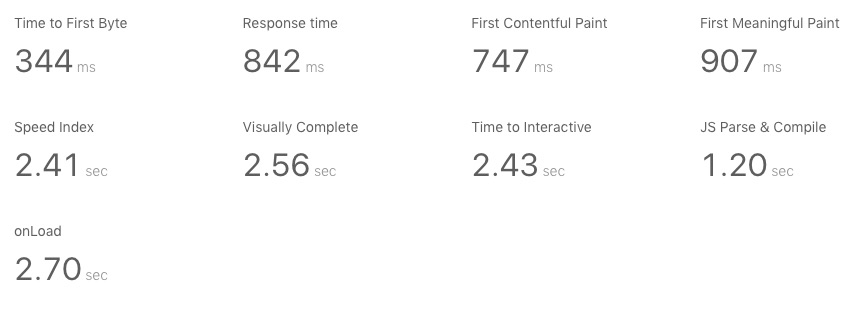
Alongside that, it also has a range of other features, including:
- Performance budget management
- Third-party script tracking
- A great alerts system revolved around the budgets you set as well as a weekly/monthly performance summary
Speedcurve
Speedcurve is another great option for speed monitoring, offering a wide range of every-growing features such as:
- Performance budget management
- An impressive performance alerts system
- A changes report that highlights important changes for the site
- Daily performance measuring with great data visualisation, this is probably the best tool for it!
- A real user monitoring (RUM) solution called LUX. This isn't CrUX data at involves adding a JS snippet to your site, so arguably better than CrUX as you can measure the speed for all your users, not just those on Chrome that allows browser data to be shared.
- Light and dark themes ?

This tool is incredibly feature-rich and a great all-in-one solution for site speed monitoring. I use this tool a lot, and it works brilliantly.
The team at Speedcurve are also constantly rolling out new features, so if you're looking for a tool that is always at the forefront of speed measurement and diagnosis, this is a great option.
SpeedMonitor.io
SpeedMonitor.io is a great cheaper alternative to Calibre that doesn't quite have all the same features, but it's still great. Its principle is very much the same as Calibre with it utilising Lighthouse data and storing it daily.
One thing we love about Speedmonitor.io is that it also captures and stores data from the Chrome UX Report, which shows actual speed from users on your site. Handy!
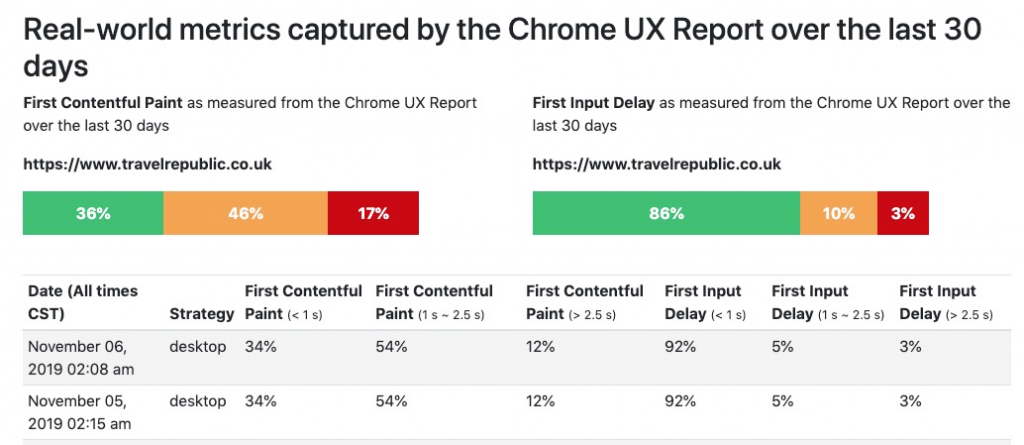
Some additional features include:
- Competitor comparisons (really useful to make a business case for focusing on site speed)
- Slack notifications around site speed!
- On-demand one-off audits
Google Search Console speed report
The Google Search Console (GSC) team recently released a handy site speed report that utilises CrUX data, and it is free! It is still experimental, but it is a great addition to the GSC toolset.
The report is found on the left sidebar under the enhancements section, and it is called called Speed:
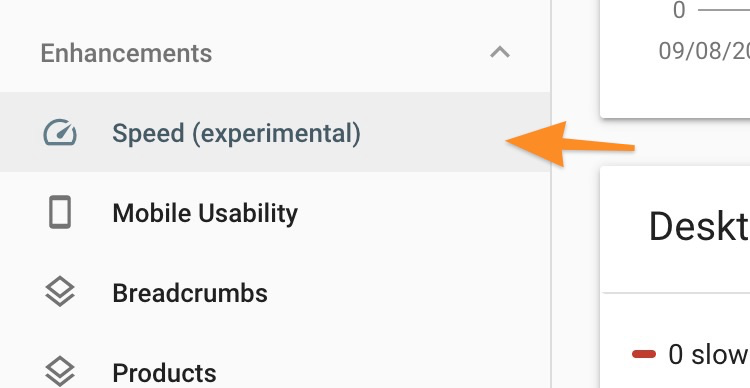
The report is split out between mobile and desktop; it also categorises all URLs on your site within the CrUX database as either slow, average or fast.
You can then go into each section, and it'll list the problem URLs individually. When you click on a URL, it gives you a quick link to PageSpeed Insights to run a Lighthouse report and see the potential issues.
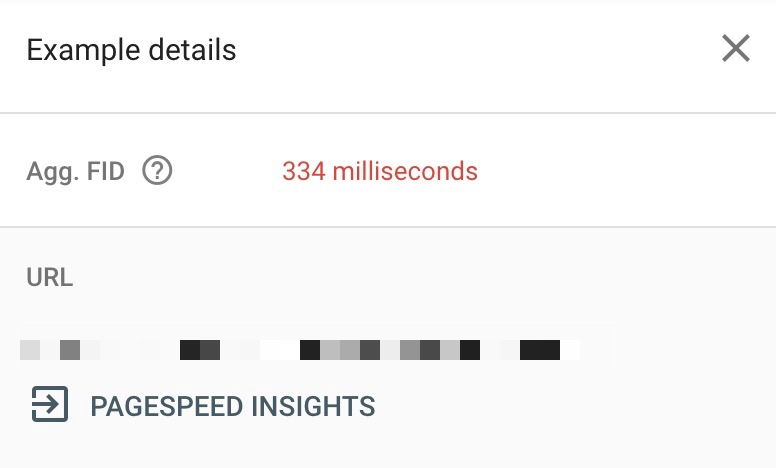
Now, it's important to remember that this is based on real-world data.
That means if a URL is loading slow for a user, it may just be because they were on a poor connection. You should, however, still take a look at the page to see if there is anything you can do to optimise it. It may just be that you've got a large unoptimised image on the page.
Data Studio
Thanks to the CrUX data studio integration, you can quite quickly get yourself set up with a measurement report that reports historic data for how fast your site has been for users for free.
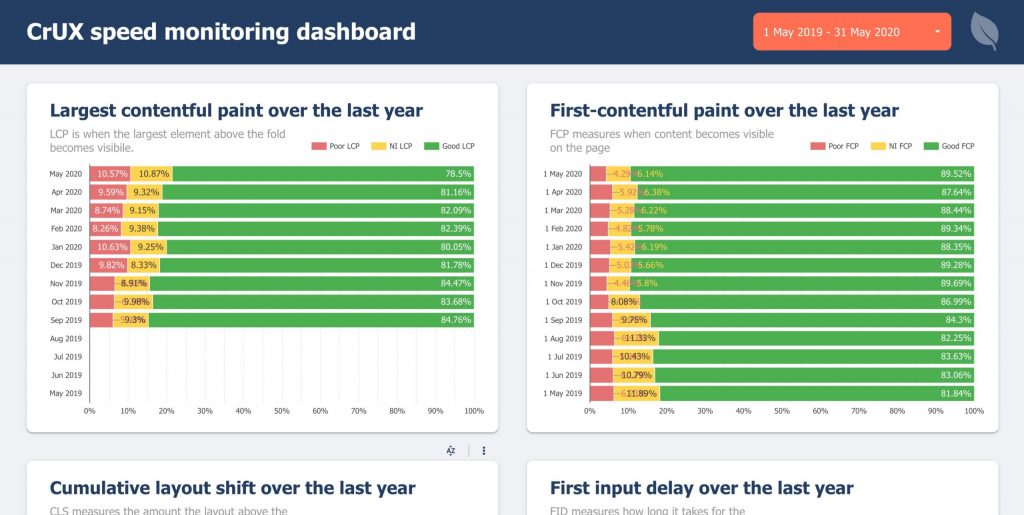
I've got this in my reporting suite and use it across all clients. What's even handier is that you could also add some competitors to a dashboard like this and do some like-for-like comparisons for how quickly your site is compared to theirs.
I have written a guide on setting up a data studio CrUX dashboard here.
Wrapping up
With the above site speed tools, you will be able to diagnose and monitor your site's performance effectively. After that, you've just got the hard part of actually making the improvements to your site!
Any new tools you've been trying out to measure performance? Let me know in the comments, and I'll get them added to the list!