In my recent post on site speed tools, I mentioned one way to monitor your site speed on an ongoing basis for free is to utilise the Chrome User Experience Report (CrUX) data studio connector to create a CrUX dashboard.
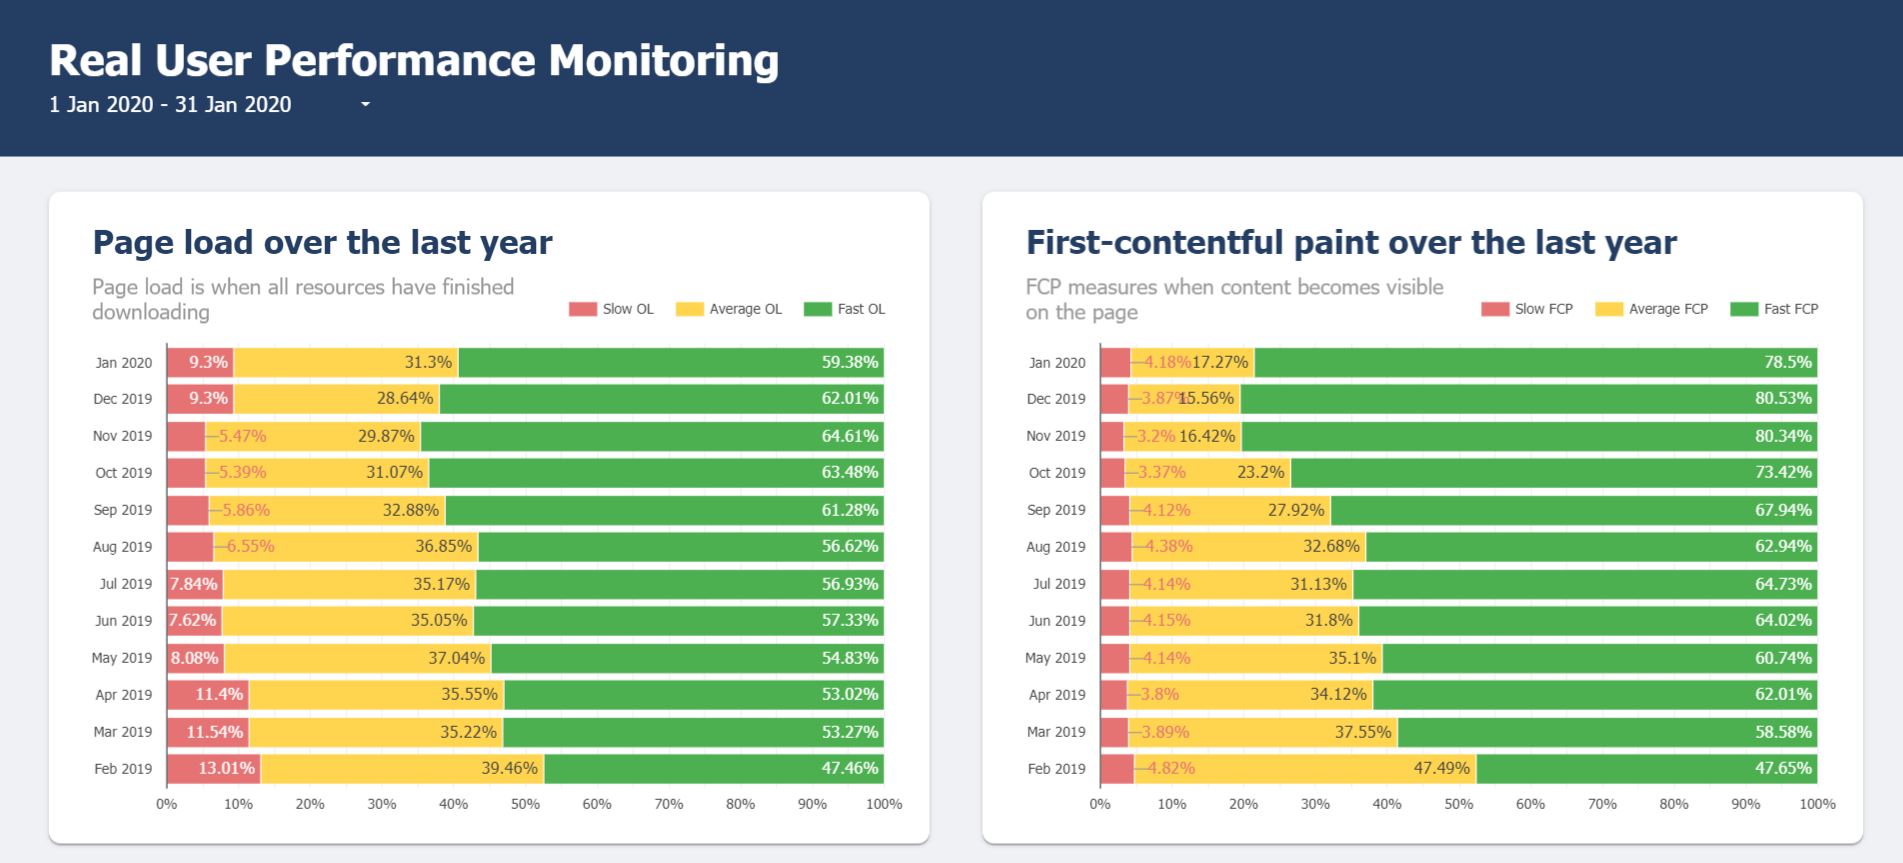
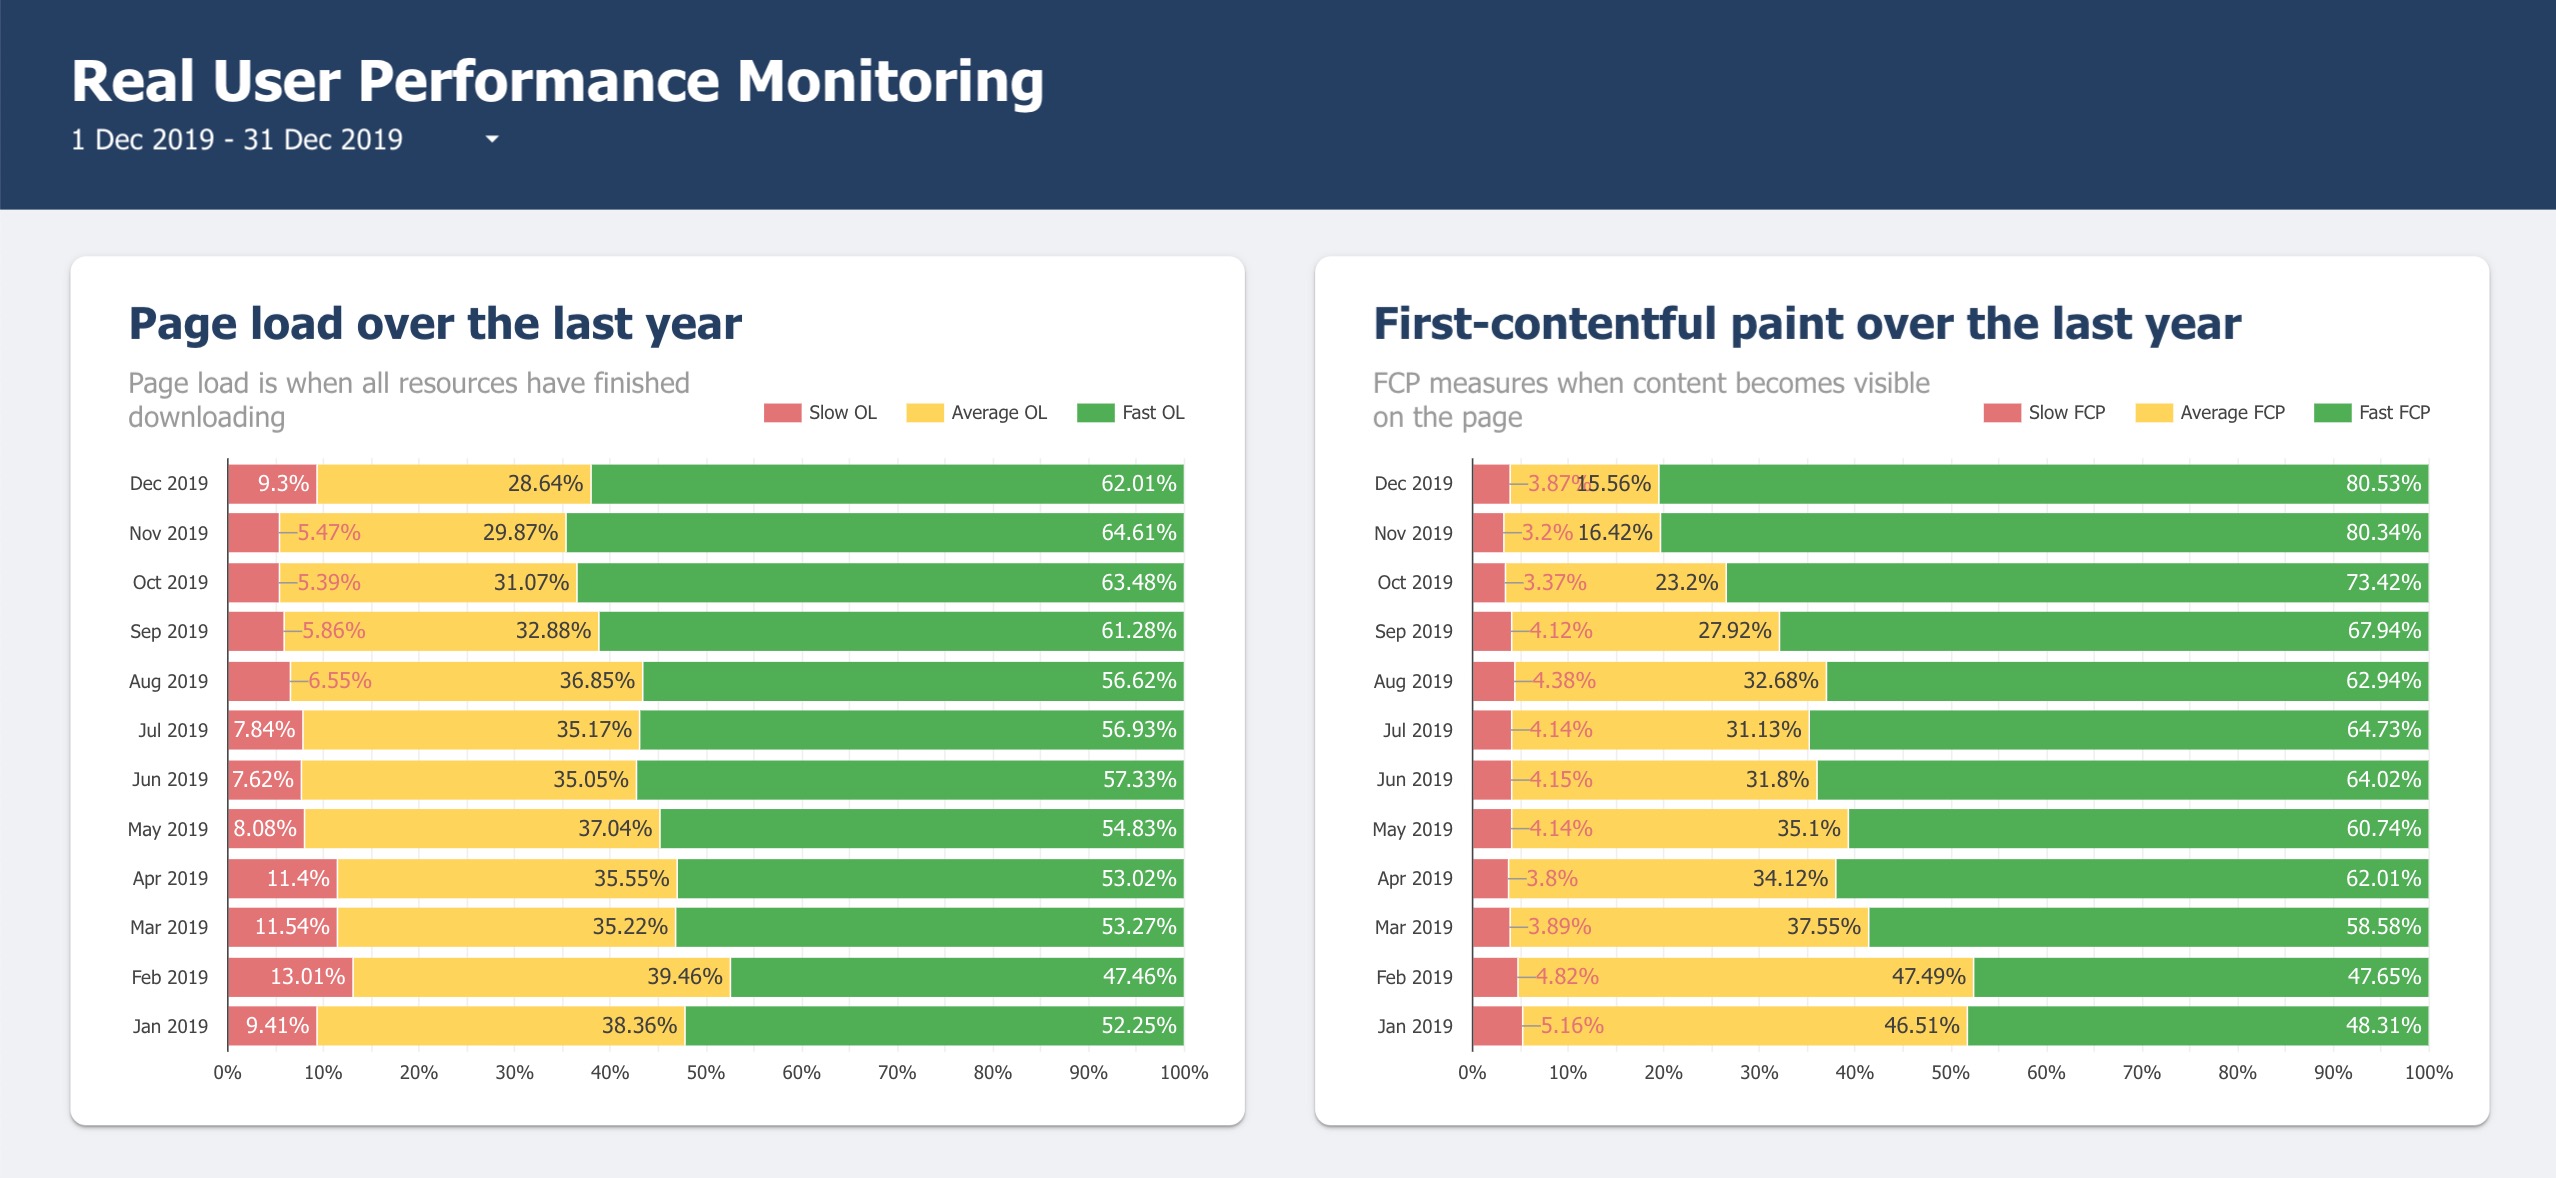
Here is an example of a CrUX data studio dashboard I use for all my clients (you'll have something similar by the end of this blog post):
What are the benefits of setting up CrUX reports?
If you're a site owner, you should have this as part of your reporting suite as it gives access to data on the experience real users have on your site. This is useful as it can answer whether site speed should be something you're focusing on.
One great benefit of utilising CruX data for this kind of reporting is that it has loads of historical data. So even if you get this report set up today, you can still see how your site performance has been for your users over the past 12 months or more.
The only downside to utilising CrUX data is that it is only a sample of users that visit your site, i.e. the users that use Chrome and allow the data to be shared. So you won't be getting the complete picture of what the speed experience is like for everyone.
To make this all much easier, I've created a free template for you to use to get started. To get started, click the below button the head on to the next section of the guide.
Getting the report setup
1. Make a copy of the template
Once you are on the template, the first step is to head to 'Make a copy' in the top bar.

2. Create a new data source
You will then want to create a new data source to set the CrUX report to whichever domain you want to analyse.
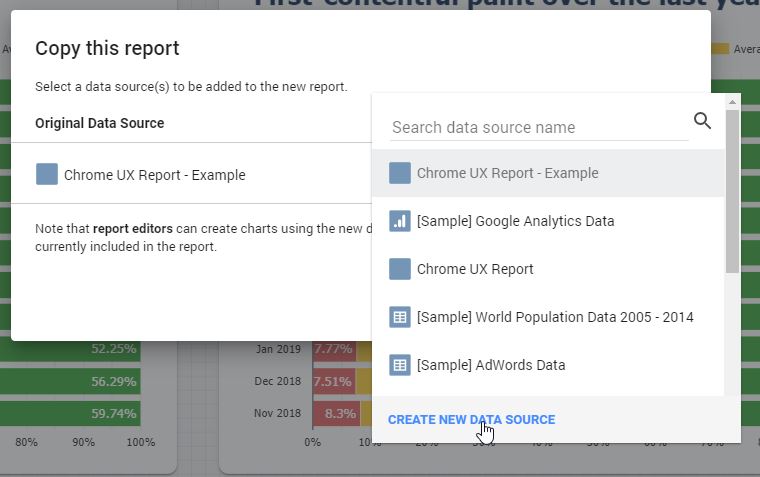
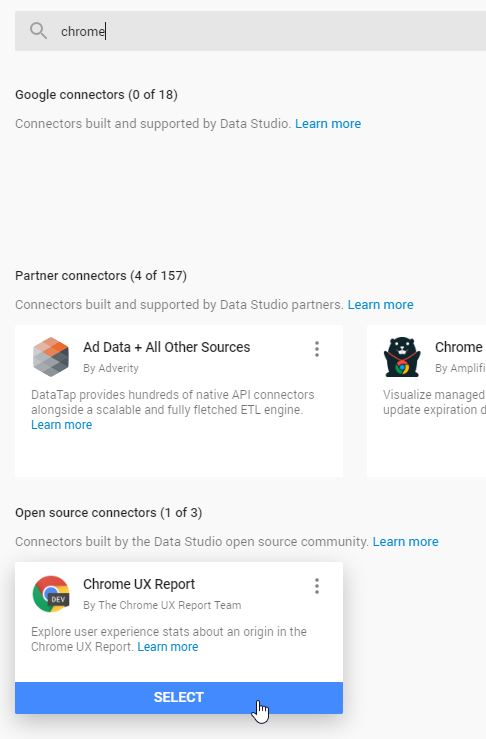
3. Search for the 'Chrome UX Report' connector
Use the search function and look for the Chrome UX Report. It will be under the 'open source connectors' header.
4. Enter the domain you want to analyse
Enter the origin URL you want to run the analysis on in your new data source, including the subdomain. If the domain is using the HTTP protocol rather than HTTPS, make sure you add that in also.

After this, click the blue connect button in the top right.
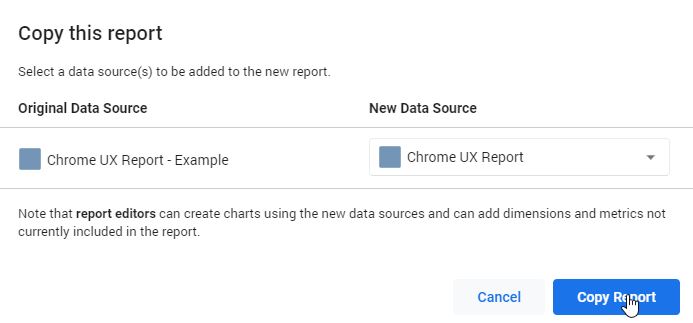
4. Keep moving, click 'add to report'

5. Then click 'copy report'
6. Enjoy your fancy crux dashboard
You've made it! You will now have a speed report that looks like the one below.
Final words
You should now have a great base template for analysing site speed, but you can take this further! One obvious thing is to set up additional data sources for your competitors to see what the experience is like on their site compared to yours.
If you need to make a business case for improving site speed, your data mixed with some competitor insights can be a great way to do this.
If there is too much red/yellow on your charts, consider looking at my list of site speed tips and diagnosing what is causing the issues using a site speed tool.